Results of Our Small-Scale, Supplementary Feeding Test
- Thomas Billington

- Apr 1, 2023
- 7 min read
Updated: Apr 2, 2025
As part of our evolving Welfare Standard and our continuous efforts to better understand fish welfare considerations in Andhra Pradesh, India, we periodically test and assess our welfare recommendations. The main goal with such assessments is to identify the best avenues for improving the lives of farmed fish through reliable, scalable, and practical interventions in fish farms.
In this post, we detail the results of one small-scale test we recently conducted—an investigation of how fishes’ growth and the water quality in farms may be affected by reducing supplemental feeding. This update is designed to inform our stakeholders of our approach to understanding the welfare of fishes better as well as to share our progress.
Summary
Over a period of 4 months, we ran a small-scale test (1 control farm, 1 treatment farm) to evaluate whether reduced supplemental feed would positively impact fish welfare compared to pre-existing feeding methods (where fishes are typically fed as much as they will eat, or overfed). Our hypothesis was:
Reduced supplemental feed would lead to reduced
phytoplankton levels and improved dissolved oxygen
levels in the test farm compared to the control, and
the growth rates of fishes will remain unaffected.
Here, any feed provided by farmers was considered “supplemental,” in recognition of the natural food sources found in the farm ecosystem (namely, phytoplankton and zooplankton).
The results of this experiment showed that reduced supplemental feed led to:
Reduced phytoplankton levels.
Unchanged dissolved oxygen levels.
Unchanged fish growth.
That is, the treatment (reduced supplemental feed) works to reduce phytoplankton levels. However, not every farm may need this treatment depending on its initial phytoplankton levels. For instance, our treatment farm had low phytoplankton levels before the test and may not qualify to receive this treatment in normal circumstances.
We are considering, then, that this intervention can be valuable but will need to be paired with an assessment system in order to only target farms with phytoplankton-related issues.
Due to our limited sample size (2 farms in total) and the presence of other confounding factors (detailed below), the results of this test must be further verified before they are applied on the ground.
Our Motivation and Rationale
The Relationship Between Dissolved Oxygen and Phytoplankton Levels
Dissolved oxygen (DO) refers to the amount of oxygen that is available within the water for fishes to breathe. In farms with Indian major carp (the main species we focus on in our India work), DO levels are often too low, too high, or erratic, and this causes fishes to suffer. A main cause for erratic DO levels has been found to be uncontrolled phytoplankton. For a deeper explanation, please see the Background section of this recent post.
Further, our observations and experience working in Andhra Pradesh, India, pointed to overfeeding being a common occurrence in fish farms—Farmers overfeed fishes, leading to release of high levels of nutrients in the water, intended to nourish fishes but wholly unutilized by them. Instead, these excess nutrients feed phytoplankton, causing their populations to swell.
Our hypothesis is that, were supplemental feed quantities to better match fishes’ needs (rather than exceeding them), the fishes would not be negatively affected (as they are not using the excess nutrients anyway) and phytoplankton populations would decrease (as there is a lower supply of nutrients to support their proliferation).
This would, in turn, improve fishes’ lives by creating more stable oxygen levels with fewer highs and lows.

The Study Design and Methodology
Please see the Appendix for all details pertaining to the study design and methodology.
Selecting and Preparing Farms for the Test
Two farms, comparable in size, location, and prior conditions, in Bantumilli, Andhra Pradesh, India, were chosen—both farms were owned by the same farmer and had a similar cultivation history. Both farms also already contained water.
We captured fishes that were in the farms and released them into a local canal. Often, native fishes from the canal will enter the pond systems through water inflow. In order to ensure that there were no native fishes competing for food, we used cast nets to capture the fishes and release them back into the canal. We repeated the cast netting process until no more fishes were in the water.
Following this, we added sanitizer into the water; we then pumped in additional water until a depth of 6–7 feet was attained.
One farm of 1.84 acres was considered the control farm and the other, of 1.62 acres, was considered the treatment farm.

Stocking the Farms with Fishes
Typically, farmers purchase juvenile fishes for their farms from what is called a “rearing pond.” For our test, FWI confirmed that the juvenile fishes were not diseased or otherwise in poor health or welfare, prior to the farmer purchasing the fish.
Juvenile rohu (Labeo rohita) and catla (Catla catla) fishes were transferred from the “rearing pond” to the test farms as per the predesigned stocking densities of 2700 fishes per acre.
Feeding Methods
Fish were fed exclusively de-oiled rice bran, using the bag-feeding method. This is a typical system for Indian major carp where supplemental feed is placed in sack-like bags with holes at the bottom; the bags are suspended across a farm with each bag partially submerged in the water. Fishes nibble at the feed through the holes, as seen in the following video.
Test Conditions
The test ran from November 2022 through March 2023.
The feed quantity in the treatment farm (with reduced feeding) was decided using a weight-based design from our Fish Welfare Specialist, detailed in the Appendix.
The feed quantity for our control farm was decided using the “blind” feeding method, where supplemental feed is introduced up to the point that any increase would result in not all the feed being eaten by fishes—this is the method typically implemented by farmers. Where there were uncertainties with the blind feeding method, the farmer who owned these farms and another Alliance for Responsible Aquaculture farmer were consulted.
Data Collection
Farms were observed twice daily—once in the morning (between 6:30 and 8:30 AM) and once in the evening (between 04:30 and 06:30 PM).
The full raw data can be found here.
External and Confounding Factors
Our test results may have been affected by the following external factors, details of which are provided in the Appendix.
Proximity of our control farm to a rice mill, active since December 16, 2022: Rice debris blowing into the farm from the mill may have increased nutrient levels, and consequently affected the phytoplankton levels.
Disease outbreaks in both our farms: Although we were implementing disinfection protocols, diseases are very common in Andhra Pradesh carp farming. Fortunately, this outbreak was fairly mild, as we were able to identify and treat the disease quickly
Application of fertilizers and sanitizers during the test to both farms, albeit in equal quantities at the same time.
Results and Implications
The treatment farm was, on average, given 17% less supplemental feed (though it varied some over time) than the control farm. On average, the treatment farm had 22% less of Chlorophyll a—a naturally-occurring pigment that is a strong signal of phytoplankton population density—than the control farm (with a standard deviation of 39%).
Our analyst ran statistical models on our data in order to directly assess whether the hypothesis holds (“reduced supplemental feed would lead to better phytoplankton and dissolved oxygen levels than the control, and growth rates will be the same”). These models took into account differences in morning and evening measurements as well as the different seasonal periods (November 2022–March 2023).
These were the main takeaways:
The levels of Chlorophyll a and phycocyanin, which are strong proxies for phytoplankton levels, were reduced in the treatment farm.
Fishes’ weight showed no significant correlation with the treatment, implying that treatment had no effect on their growth.
Turbidity positively correlated with treatment, which was an unexpected result.
DO levels showed no significant correlation with treatment, implying that even though the treatment reduced phytoplankton levels, this did not translate into improved DO levels.
For details, please see the Appendix.


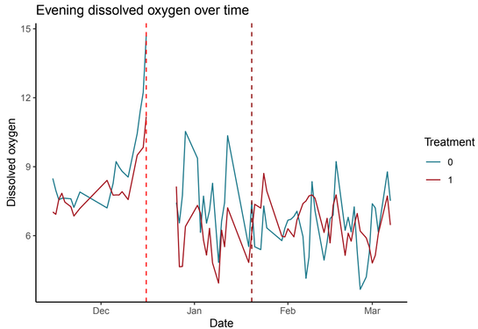


Graphs that show the trends in the treatment (red lines) and control (blue lines) farms.
Top left : Chlorophyll a levels in the morning; Top right : Chlorophyll a levels in the morning;
Middle left : Dissolved oxygen levels in the morning; Middle right : Dissolved oxygen levels in the evening; Bottom left : Feed quantity levels; Bottom right : Growth rates of fishes.
The vertical dotted line between December and January indicates rice debris blowing into the control farm.
The vertical dotted line between January and February indicates the disease outbreak starting in both farms.
For information, see External and Confounding Factors above.
Conclusions
These results suggest that the treatment worked to reduce phytoplankton levels, but that the farms did not need this.
Considering the small sample size and the confounding instances, these results are extremely tentative and should only be seen as an indicator of the correlations. However, they do seem to be indicating that phytoplankton levels are reduced by reducing supplemental feeding through a weight-based feeding system.
The results of this test reinforce three ideas:
Reducing supplemental feed (through a weight-based feeding system) is likely a strong intervention for farms with phytoplankton overpopulation.
Proactive improvements applied to all farms indiscriminately may have negative effects on some farms.
Feed management practices are best coupled with fertilization protocols, in order to ensure that they do not exacerbate pre-existing problems
For a detailed discussion of the findings, please see the Appendix.
Next Steps
This test has increased our interest in a system of evaluating farms for phytoplankton problems and then assigning a weight-based feeding strategy (with periodic phytoplankton evaluations) to those farms that have phytoplankton-related issues. We currently plan to replicate this test in more controlled conditions and across more test farms in order to further develop our understanding of the correct supplemental feed quantities and the situations they should be applied in.
As always, we welcome any feedback you may have on our findings or analytical approach—feel free to comment below or contact us.
Important links:
Raw data from this study.
Appendix with additional details of the study.
Blogpost: Announcing Version 2 of our Welfare Standard explaining the links between DO and phytoplankton levels.


Comments